On thursday night, I planned to work a little on this big ember app I’m working on for a client. For some reason, even though my app was the only tab opened, Chrome had a pretty high CPU usage. Now, I know Chrome is generally good at that, but I was intrigued. My app can use quite a bit of your CPU at times, but just sitting there, idling around, this should not happen. Opening the Chrome task manager, I determined that indeed, it was my app that was causing the load.
“Okay, let’s use the profiler” I hear you say, and that’s what I did. The profiling result looked like this:

protip: Do your profiling in an incognito window. That way stupid extensions won’t interfere with your measurements.
That’s a little relieving, but also a little embarassing. At this point, I was out of options. Something in my app, which was not my JavaScript, was causing a high CPU load. So, how do I debug this? I have no idea. But maybe I know someone who does have an idea. And so I asked Malte of JSConf.eu fame, who I figured probably did a good bit of browser profiling during building AMP, if he had any ideas. His answer was simple:
@halfbyte about:tracing !!!
— Malte Ubl (@cramforce) September 29, 2016
Honest question: Did you know about about:tracing? Because I certainly didn’t.
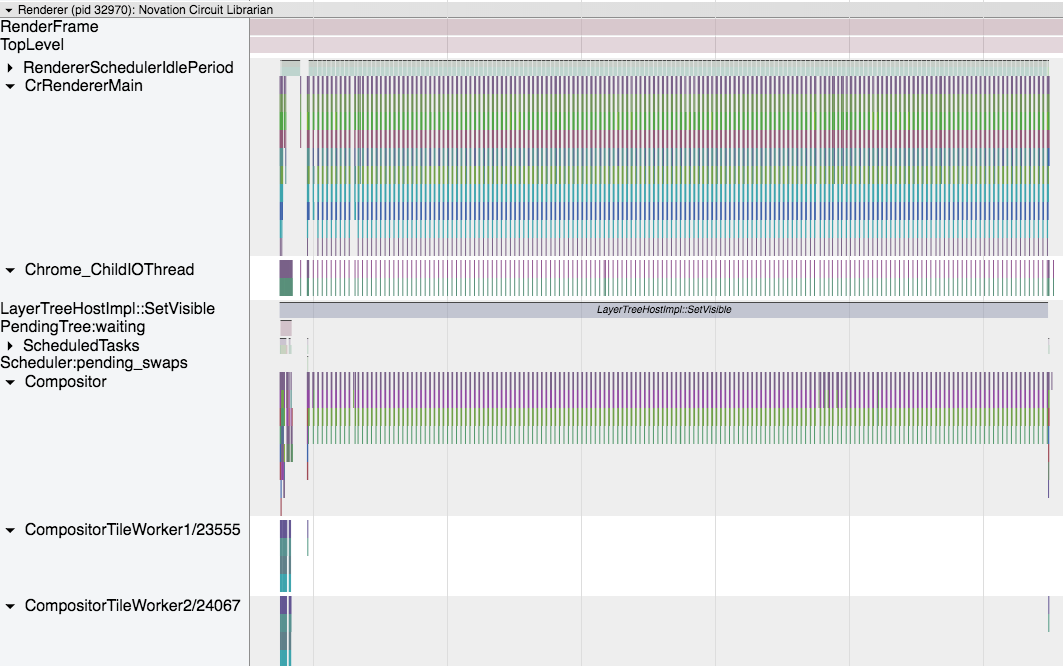
So, about:tracing opens up a new window that allows you to do deep traces into the Chrome code, very similar to what you would do with strace or dtrace. It displays the results in a beautiful way that immediately showed that my app seems to have a problem:

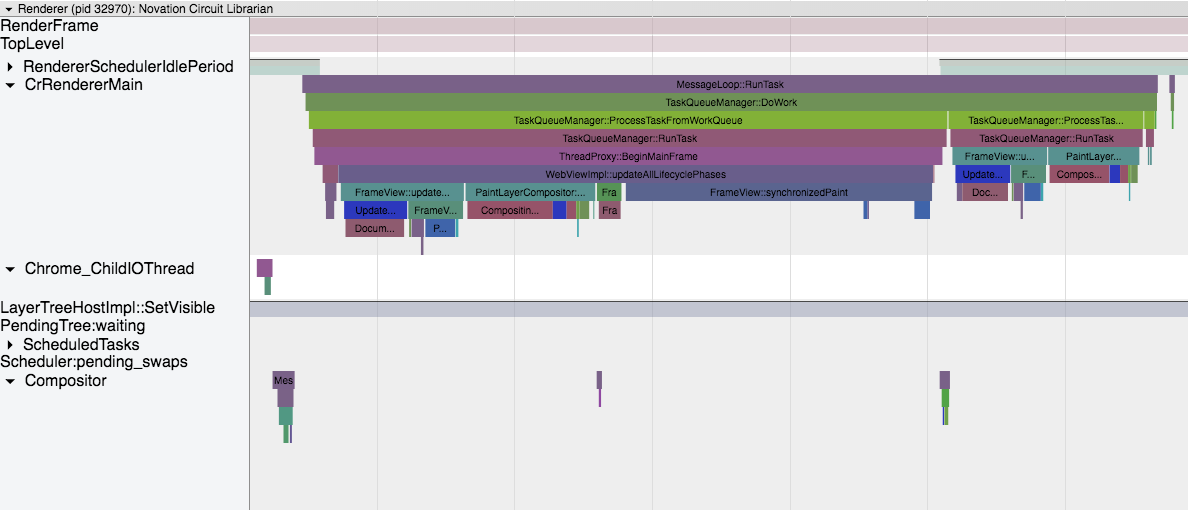
You can then zoom in on the diagram and you can actually see the function names that get called. This block of calls was executed every ~17ms, which conveniently converts to 60 per second:

This is a lot of stuff to do on every frame. Something was causing heavy redraws and style changes continuously. But nothing was moving on the screen. NOTHING.
But I had the hint that I needed. It seemed to me as if the problem was caused within the realms of CSS. And then it hit me: There’s a CSS animation running continously that animates an SVG. As Paul Irish later confirmed, with SVG, this currently means repainting the whole SVG image.
And obviously, Chrome doesn’t have any working heuristics in place to see if that thing, that needs to be redrawn, is currently visible. Because the SVG, for 99.99% of the time, is hidden in a div that is display:none.
Luckily that means I have a very easy quick win fix: Simply disable the animation when the div is hidden. The class structure for that was already in place I just had to add an additional scope to the animation.
Also, Paul immediately came up with the correct fix:
@halfbyte @cramforce solution: separate the static image components into their own SVG (and compositing layer): https://t.co/WjMkYIxJUo
— Paul Irish (@paul_irish) 29. September 2016
Which I will consider for later. For now, the 80% (or rather, 99.99%) fix is good enough.
So, I may have, after enough thinking, come up with the idea that the SVG was causing the problem. But about:trace definitely helped a lot and I’m still a bit blown away by the fact that chrome ships with this built in. Which is one of the reasons Chrome, after all the bad things I could say about it, is still my main browser: It simply has the best dev tooling, period. (Apart from the fact that, due to the MIDI API, the app in question only runs on Chrome. Well, and Opera.)
Also, of course many thanks to Malte and Paul for their very quick help. I’ve learned a lot and will approach SVG and animating them a bit more carefully now. And probaly tell every one about how great about:trace is :)
